Hey there, it’s Yaakov from Valubyl. Welcome to another edition of Product Led Growers, my newsletter that simplifies product activation and adoption + curates the best PLG resources.
In this week’s newsletter, we cover:
✅ Activation before retention.
🔑 The simplest way to start increasing activation.
👏 Exciting update - New PLG resource database!
✚ The best new PLG resources
Let’s dive in!
Activation Before Retention
Let’s get something clear.
Stop trying to improve retention when your product’s activation is broken.
It’s super important to make sure that you're not skipping steps.
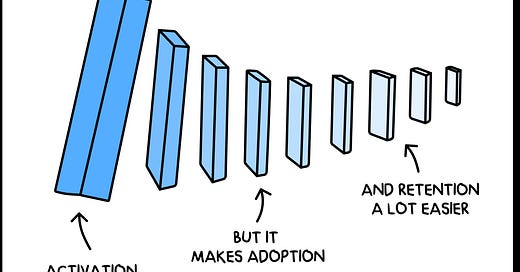
Oversimplifying it completely, imagine the journey like this:
Activation: When users think, "Hey, this is pretty cool!", more than once.
Adoption: Your product becomes a go-to in their workflow.
Retention: They just can't get enough and keep coming back.
You gotta give each stage its own time and love. Each step needs its own plan and attention.
And sure, as you're sorting out activation, retention is always on the mind. But a little heads-up, before going too deep into retention be sure to double-check your activation. It usually clues you in on what users are really looking for.
Get your activation game strong, and you'll see it's not just about that initial spark. It sets the tone for the entire user journey, from the first click to long-term loyalty.
Now that we understand we have to first focus on fixing activation, the obvious question is where do we start?
The simplest way to start increasing activation 🔑
As I defined in my previous post about why most SaaS companies fail at activation 👇
It’s important to note that activation is not just about amassing signups or rushing users toward payment. It’s a nuanced phase of the customer journey that, when executed right, will lead to increased engagement and higher revenue.
Focus on showing real value, guiding users toward key features, and nurturing them towards deeper engagement and building habits.
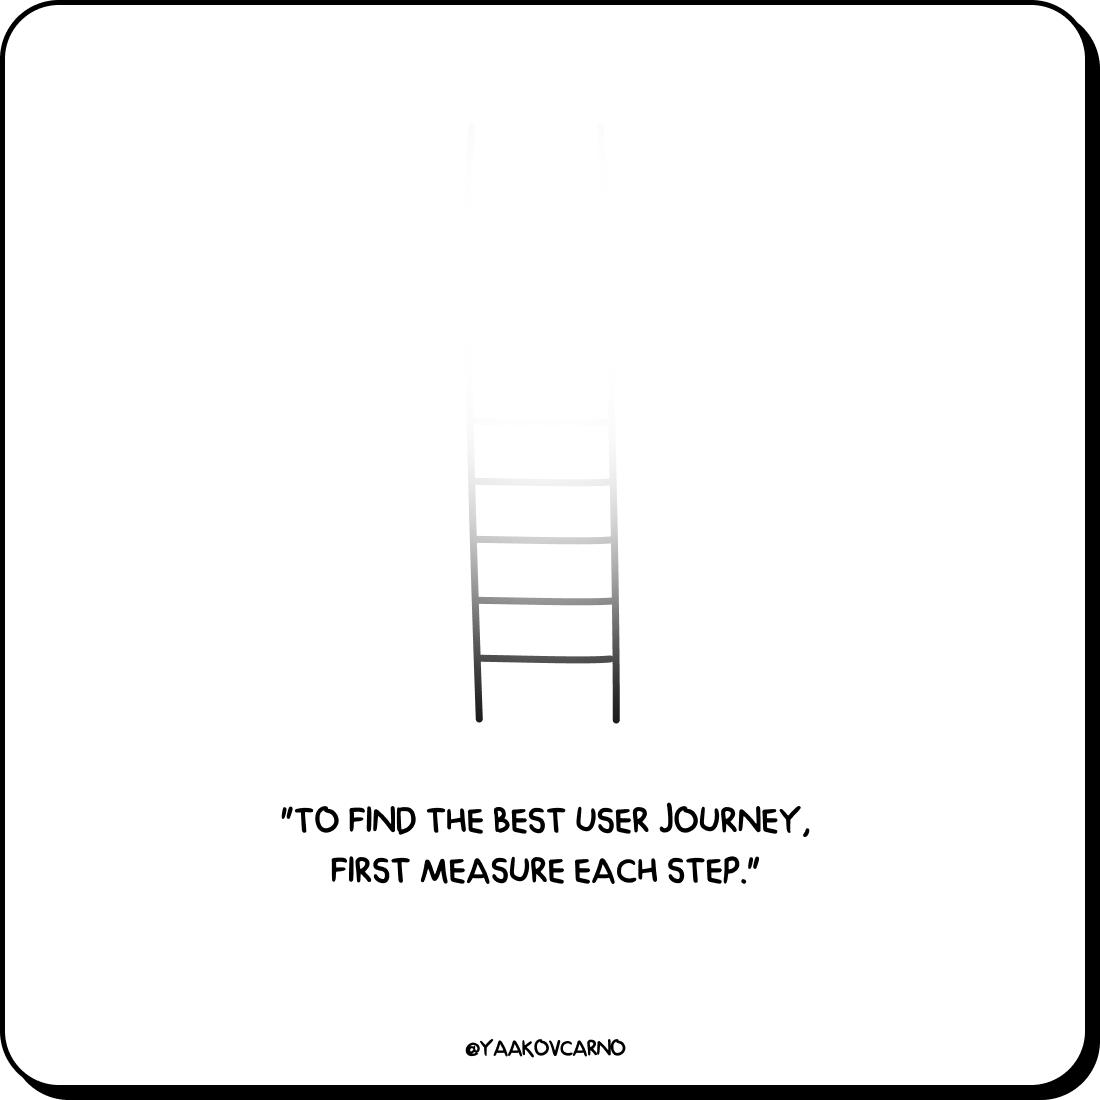
The work that needs to be done is actually mapping out the path from discovery to value so that you can best build the user journeys that will lead to activation.
Here is a simple exercise that you should do with your team to to design the most efficient and effective users journeys so that you can guide your users through different activation milestones and ultimately help them solve their problem and/or achieve their desired outcome as quickly as possible.
You want to be able to answer:
Which steps can be delayed?
Which steps can be removed?
Which steps are essential in getting users to their goal?
It’s as simple as this:
Write out your user journey into steps.
Go through each step and ask yourself:
Is this necessary?
Would I understand this if I was seeing it for the first time?
Remove all unnecessary steps.
Simplify the steps that are hard to understand.
Keep a list of all the changes you’ve made.
Measure the results.
Assess A/B testing options.
Repeat.
Now, the real question you have to ask is:
What does the data say?
You know, like where are users getting stuck?
Do you know where they're dropping off, do you know where they're succeeding?
If you can't answer these questions, you're probably in one of these situations:
😱 Hopeless: Not tracking product usage data at all
🙃 Confused: Tracking a bit over here and a bit over there
🤷♂️ Need a hand: Got the data, but don't know how to get the right insights
If you're not tracking product data, well you best get started!
If you are, but you're just feeling a bit stuck not getting the clarity you're looking for, then this is for you.
This next step in the exercise is a simple process to ask the right questions and set up your product data in the easiest way to find optimization opportunities.
Step 1: Clarify Your Questions
Before diving into the data, it's essential to understand what you're trying to achieve.
Identify for yourself:
I want to understand {...} or I want to prove {...}
Quantitative Examples - Data that can be measured and written down with numbers:
Drop off points in user flow.
Actions users take before they activate/convert.
The first thing users do on your platform.
Specific user segments that perform better or worse.
Qualitative Examples - Data that describes qualities or characteristics:
Areas where users most frequently seek help or support.
Common feedback or complaints from support tickets.
Feedback from sales calls and product interviews.
Step 2: Map Out the User Journey
Visualize the user's journey. Sketch out or list the different actions or steps users take within a particular feature or throughout the product.
Example:
Lands on homepage
Clicks 'Sign Up'
Fills out registration form
Lands in empty state
Clicks “add new X” CTA
Etc…
Step 3: Tag Relevant Events
Using your map, label the specific events you're tracking at each step. This will form the backbone of your data analysis.
Example:
'Homepage Visit'
'Sign Up Clicked'
'Registration Form Completed'
'Viewed empty state'
'AddNewX CTA Clicked'
Step 4: Visualize Data Flow in Analytics Tool
For this example, we'll use Mixpanel, but the principles apply to other platforms.
Review the sequence of events from your map.
In Mixpanel, construct a funnel that mirrors this flow.
Review the funnel's data and first ask: "Is this reliable/accurate?"
Step 5: Go Deeper with What, Why, and How
What: Identify which steps or features see the highest/lowest engagement. (e.g., What step in the user journey has the most drop-offs?)
Why: Understand user motivation and pain points. (e.g., Why are users dropping off after landing in the empty state, why don’t they click the CTA?)
How: Determine methods to enhance user experience. (e.g., How can we make the empty state simpler and make the next steps more clear for the user?)
Step 6: Close the Loop with Actionable Insights
Optimization Loop: Your journey should always loop from asking questions to collecting data, gaining insights, and then taking action based on those insights.
By following these steps and implementing the continuous optimization process on a weekly/monthly/quarterly basis (depending on resources), you’ll be surprised at all the obvious (and novel) insights and improvements that get surfaced and how easy it becomes to identify where you need to double down on to get more users to activate.
Obviously this exercise, along with every other exercise and framework out there, isn’t going to work the same way for every product and team and it’s up to you to apply and adapt it to your unique product types and audience’s needs.
If you’d like a hand getting started or interested to run an interactive team workshop, just reply to this email and we can set it up 🤝
New PLG resource database! 👏
Here's a free gift for you 🎁
I've stacked up the biggest collection of my favorite product-led growth resources, packed them all up into a beautiful Notion database, and now you can access it all for FREE 🤩
Dive into:
💡 Pro-level educational insights
🔎 Must-have essential resources
👀 Engaging interactive learning modules
🤝 Dynamic PLG communities and network
💻 Go-to tools for your PLG tech stack
📚 Handpicked books to fuel your PLG journey
Check it out 👉 https://productledgrowers.notion.site/
And let us know what you think!
The best new PLG resources ✚
Every week I’ll be updating you with new PLG resources I discover 👏
🚀 How an AI sidecar product drove 30% of sign-ups by Kyle Poyar and Shin Kim
Explore how Eraser's AI sidecar product, DiagramGPT, significantly contributed to user acquisition and product growth.
💡 The ultimate product-led onboarding playbook by Dopt
Uncover the art of user-centric onboarding to propel user activation and retention in your product!
💸 Why your pricing might inhibit PLG by Ben Williams
Delve into the intricate dance between pricing and PLG, unveiling real-world hurdles and the undeniable value of human touch in certain sales scenarios.
🔥 The Product Activation Playbook by Enzo Avigo
Explore June's Activation Playbook to discover how a well-structured onboarding process can significantly boost your user retention and product growth!
🔎 Onboarding Study by Andrew Pacholik
Analysis of over 220 SaaS products and 100+ tactics.
See you next week! :)


